Plasma Module
Improved Stability of the Finite Volume Discretization
In COMSOL Multiphysics version 5.2, the finite volume discretization has been improved by eliminating numerical overflow errors. As a result, expect less nonconvergence of models when using the finite volume discretization.
The "Reduced Electric Fields" Study Supports Units
The Reduced Electric Fields study now interprets units. The SI unit for the reduced electric field is Vm2, but you can also enter a value in Townsend, e.g., 10[Td].
Models using the Reduced Electric Fields study interpret the unit in the edit field for the reduced electric fields as Townsend. For example, when opening a model created in COMSOL Multiphysics version 5.1, if the value for the reduced electric fields was 10, it will now appear as 10[Td] in the study settings.
The settings window for the Reduced Electric Fields study, showing units.
The settings window for the Reduced Electric Fields study, showing units.
Improved Material Data for Equilibrium Discharges
Certain outlying data points in the equilibrium discharge material data have been removed. Linear is now the default interpolation method (in previous versions of the software, the default method was Piecewise cubic). Both of these changes increase numerical stability when solving.
Smith Plots: A Conventional Way to Present Matching Properties
A new Smith plot group allows you to plot impedance, admittance, and reflection data in a Smith grid. Smith plots are useful for relating complex-valued S-parameters (reflection coefficients) to input impedance, admittance of antennas, transmission lines, or other network components. For studies where an S-parameter plot is generated by default, a Smith plot is automatically generated.
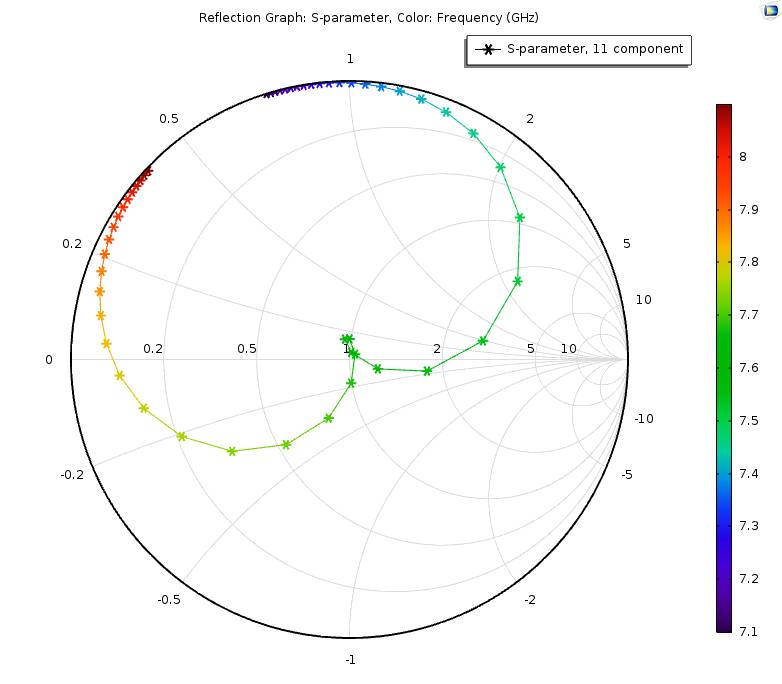 Smith plot of the CPW bandpass filter where the color scale indicates the simulation frequency, showing that the filter is matched to 50 Ohm around 7.65 GHz.