
Material Fatigue
What Is Material Fatigue?
Material fatigue is a phenomenon where structures fail when subjected to a cyclic load. This type of structural damage occurs even when the experienced stress range is far below the static material strength. Fatigue is the most common source behind failures of mechanical structures.
The process until a component finally fails under repeated loading can be divided into three stages:
- During a large number of cycles, the damage develops on the microscopic level and grows until a macroscopic crack is formed.
- The macroscopic crack grows for each cycle until it reaches a critical length.
- The cracked component breaks because it can no longer sustain the peak load.
For certain applications, the second stage cannot be observed. A microscopic crack instead grows rapidly, causing sudden failure of the component.
The details of the last two stages are usually considered within the topic of fracture mechanics. The term fatigue applies mainly to the first stage. There is, however, some overlap between the disciplines and the measured number of cycles to fatigue often includes the last two stages as well. Because the largest part of the component's life is spent before it is possible to observe a macroscopic crack, most designs aim to avoid ever encountering such damage.
Fatigue Variables
Under the influence of a nonconstant external load, the state in the material also varies with time. The state at a point in the material can be described by many different variables such as stress, strain, or energy dissipation. The fatigue process is typically viewed as controlled by a specific such variable. A load cycle is defined as the duration from one peak in the studied variable to the next peak. In a general case, all cycles do not have the same amplitude. For a superficial discussion, it can, however, be assumed that the fatigue-controlling state variable has the same value at the start and end of each load cycle. In elastic materials, a cyclic load causes a periodic-cyclic stress response. For such cases, the load cycle is easily defined. This is illustrated by the figure below, where stress is the fatigue-controlling state variable.
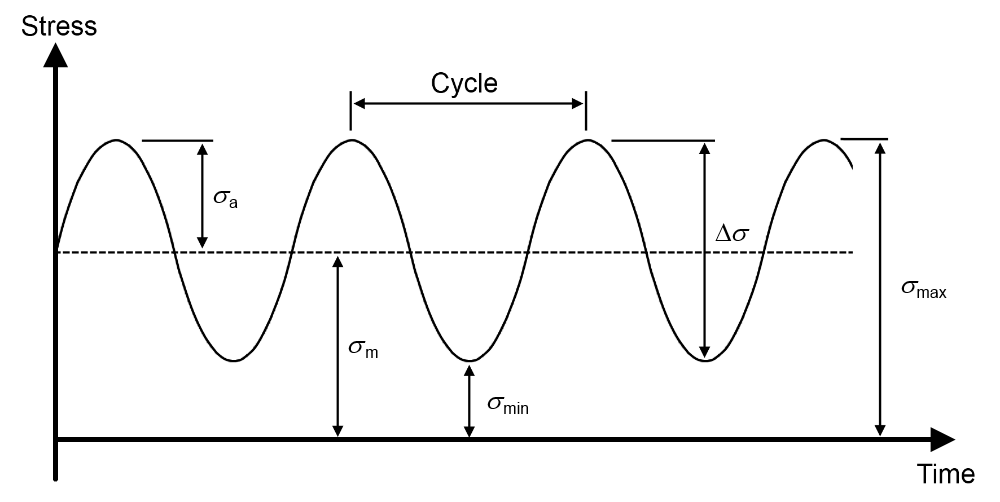 Figure depicting common variables that are used to predict material fatigue.
Common variables used for fatigue prediction.
Figure depicting common variables that are used to predict material fatigue.
Common variables used for fatigue prediction.
The stress varies between a maximum stress, \sigma_{\textrm{max}}, and a minimum stress, \sigma_{\textrm{min}}, during a load cycle. In the field of fatigue, the variation in stress is often defined using the stress amplitude, \sigma_{\textrm{a}}, and the mean stress, \sigma_{\textrm{m}}. Further, variables defining the stress range, \Delta\sigma, and the R-value are frequently used to describe a stress cycle. The relation between the different fatigue stress variables is
The most important parameter for the fatigue damage is the stress amplitude. For any detailed analysis, the mean stress, however, must be taken into account as well. A tensile mean stress increases the sensitivity to fatigue, whereas a compressive mean stress allows for higher stress amplitudes.
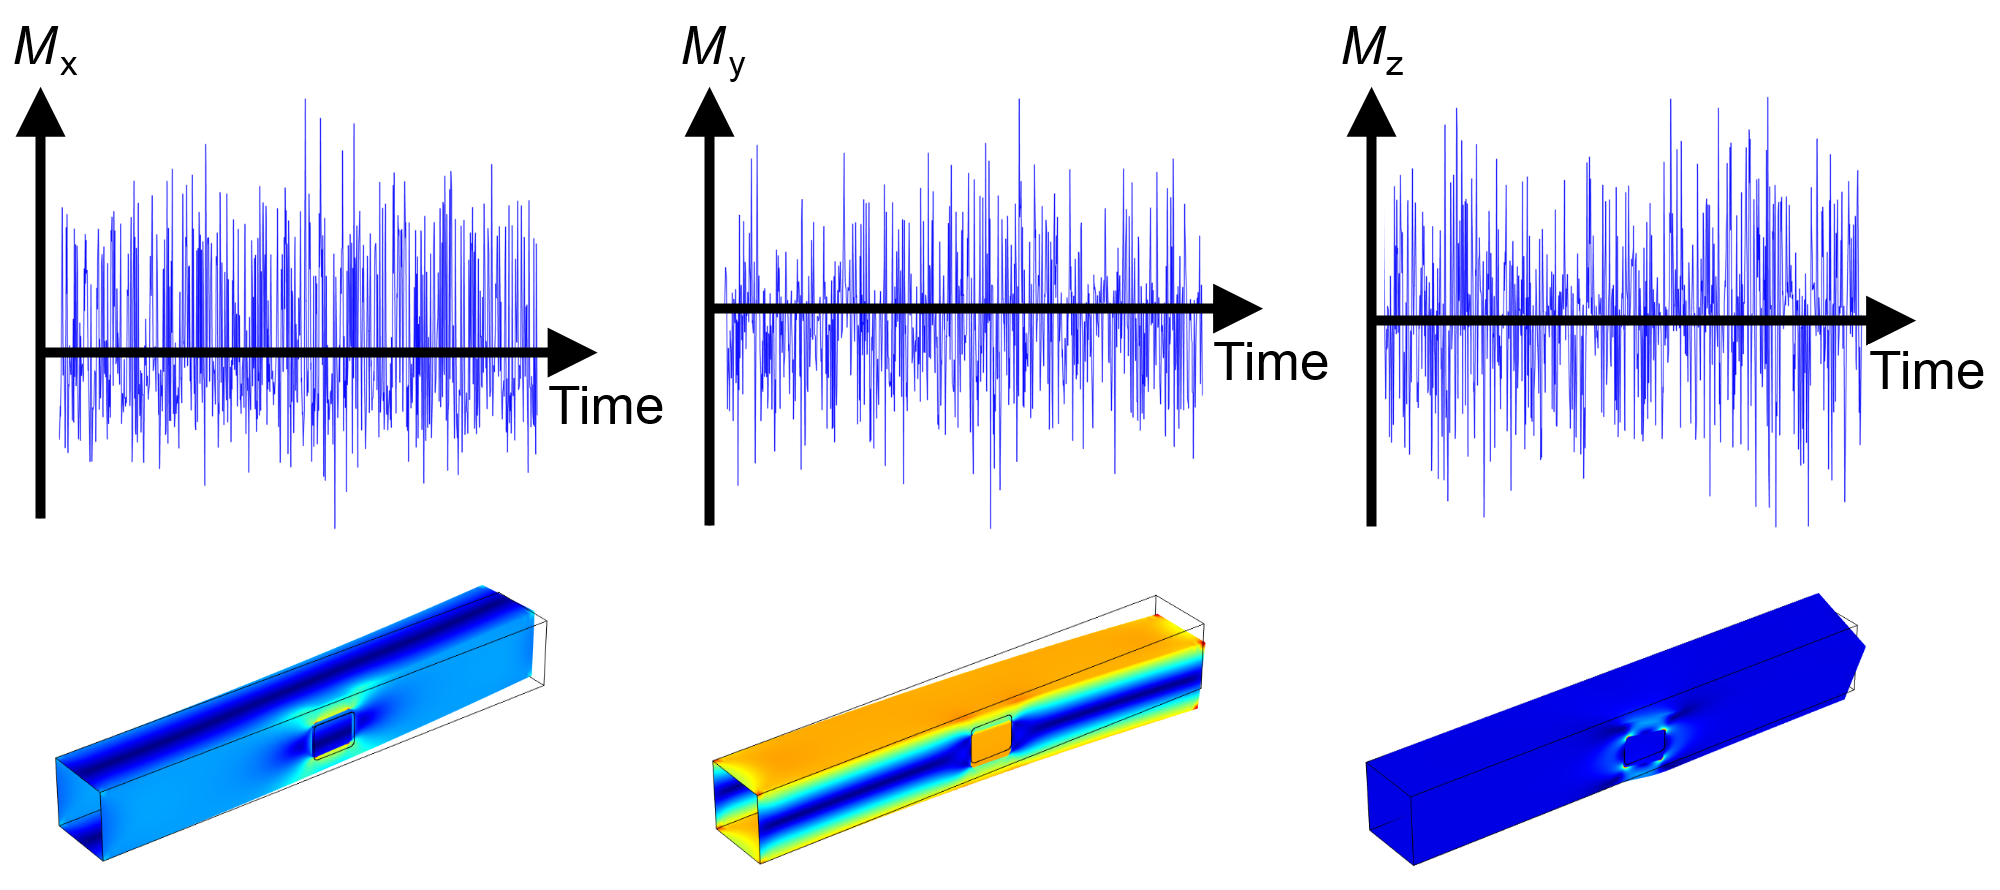
The material response to a sequence of load cycles is highly dependent on the nature of the external load, which can be periodic, random, and even consist of repeatable blocks. For the latter two cases, the description of the load cycle is not as easy as in a pure periodic case; it requires special procedures.
 Material response of a frame with a cutout that is subject to three generalized loads.
Frame with a cutout that is subjected to a random load. The time histories of three generalized loads – two bending moments and one twisting moment – are shown. Stress contours represent the material response to a corresponding unit load.
Material response of a frame with a cutout that is subject to three generalized loads.
Frame with a cutout that is subjected to a random load. The time histories of three generalized loads – two bending moments and one twisting moment – are shown. Stress contours represent the material response to a corresponding unit load.
Low- and High-Cycle Fatigue
Fatigue analysis is not always based on a stress response. This branch, however, has historically received much attention since the majority of research has been performed in regimes where stress-based models are useful. Based on the number of load cycles needed to produce a crack, it is customary to make a distinction between low-cycle fatigue (LCF) and high-cycle fatigue (HCF). The limit between the two is not distinct, but it is typically of the order of 10,000 cycles. The physical rationale is that in the case of HCF, the stresses are low enough that the stress-strain relation can be considered elastic. When working with HCF, the stress range is usually used for describing the local state. For LCF, meanwhile, strain range or dissipated energy are common choices.
Fatigue Models
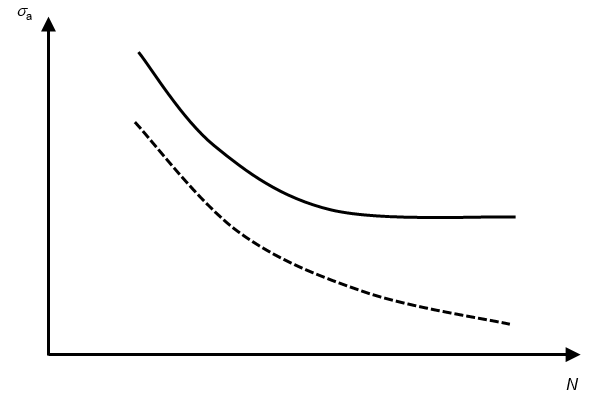
Research in the field of fatigue first began in the 19th century and its continuation has resulted in a number of methods for fatigue prediction. One of the classical models is the so-called S-N curve. This curve relates the number of cycles until failure (i.e., lifetime), N, to the stress amplitude in uniaxial loading. The general trend is that a longer lifetime is obtained with a decrease in stress amplitude. Usually, the dependence is very strong, so that a decrease of the stress amplitude by 10% can increase the lifetime by 50%. Some materials exhibit a stress threshold in fatigue testing. At stresses below this threshold, known as the endurance limit, no fatigue damage is observed and components can operate for an infinite lifetime. Not all materials have an endurance limit, though. Therefore, they can fail due to fatigue even at low levels of stress.
 An S-N curve, one of the classical models for fatigue prediction.
S-N curve for a material with an endurance limit (solid line) and without an endurance limit (dashed line).
An S-N curve, one of the classical models for fatigue prediction.
S-N curve for a material with an endurance limit (solid line) and without an endurance limit (dashed line).
In multiaxial loading, the directions or locations of the external load vary and thus deform a structure in different directions. This means that at each time instance, a full stress or strain tensor rather than a scalar value must be evaluated. This is often treated by critical plane methods, where many planes in space are investigated in search for the critical one where fatigue is expected to be initiated.
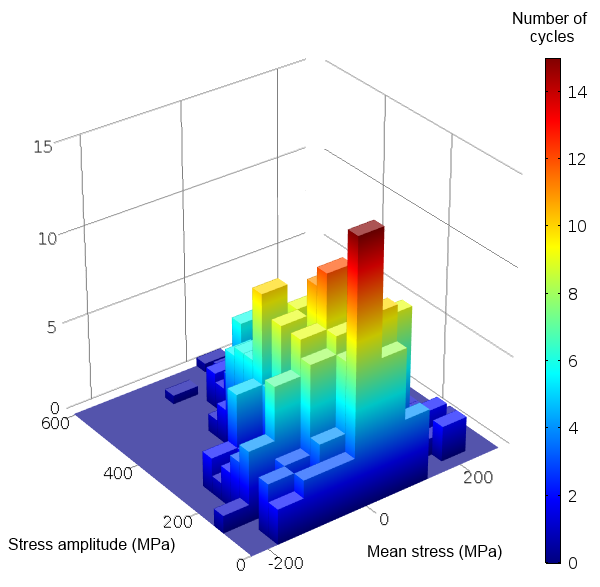
In random loading, the stress cycle cannot be described with single stress amplitudes since each cycle is different from the next. To predict fatigue, the full stress history must be transformed into a stress spectrum that can be related to fatigue in the next step of the analysis. The Rainflow counting algorithm can be used to define a set of stress amplitudes with corresponding mean stresses. The Palmgren-Miner linear damage rule is a popular way to predict fatigue under such a set of different stress levels.
 A simulation plot depicting the use of the Rainflow counting algorithm to predict stress cycle distribution.
Stress cycle distribution according to the Rainflow counting algorithm.
A simulation plot depicting the use of the Rainflow counting algorithm to predict stress cycle distribution.
Stress cycle distribution according to the Rainflow counting algorithm.
Random loading is common in vibrational fatigue where structures experience dynamic loads. Since the stress depends on the excitation frequency, the fatigue evaluation can be made in the frequency domain using, for example, power-spectral density methods.
In the case of certain materials, fatigue life is highly influenced by the number of micromechanical defects. For these materials, the location of the defects has a strong influence on the component's lifetime. For instance, a defect in the vicinity of the stress concentration significantly reduces the lifetime of a component as compared to a component with a defect that is far from the stress concentration. Probabilistic methods can be used to handle these types of applications.
When it comes to selecting a model for fatigue prediction, there is no general choice. The applicability of each model depends on both material and loading type. It is, however, possible to narrow the number of applicable models by simply asking a few qualitative questions (as seen in the blog post "Which Fatigue Model Should I Choose?").
Fatigue Material Data
A fatigue evaluation requires both a fatigue model and material data. Each model requires a different set of material parameters that can be obtained from material tests. Fatigue testing can be a rather time-consuming process, as a single test can run for many cycles before fatigue is observed. In high-cycle fatigue, for example, a specimen can last for one million cycles before it fails.
Furthermore, the influence of the microstructure on fatigue sensitivity introduces a scattering in the test results. This is caused by the fact that materials are inhomogeneous on the micromechanical level. Take an alloy, for instance, where there are crystallized grains and the grain boundaries cause stress concentrations. In a metal cast, there might even be pores formed during the solidification process. Therefore, on a local scale, the strains may be much larger than the macroscopic average values and dislocations within the crystals could occur. Because the location of such micromechanical irregularities are more or less randomly distributed, there is a large scattering in the number of load cycles that a certain type of component can be subjected to, even if the external load is well defined. Because of this, a large number of specimens need to be tested before reliable fatigue data is found.
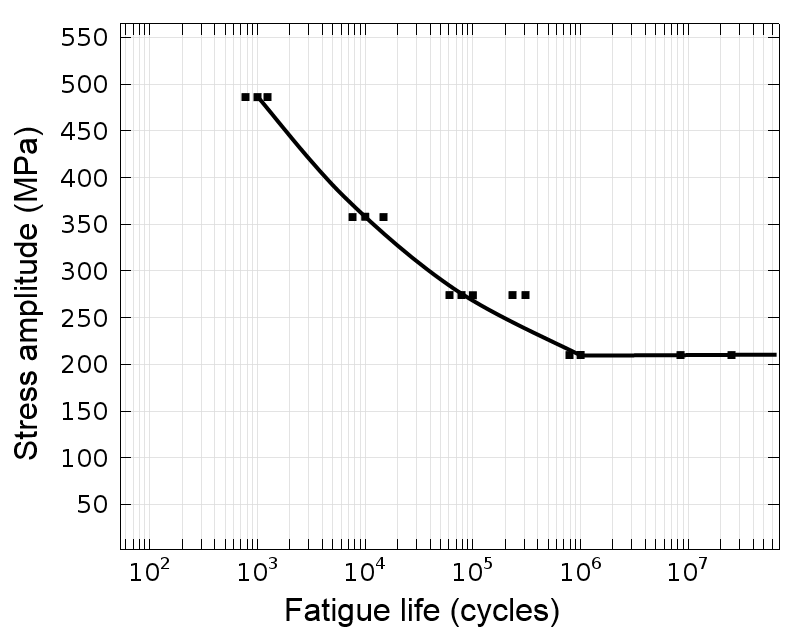 Plot of fatigue material data using an S-N curve.
S-N curve for different components of the one material. The black squares represent results from individual tests and indicate the scattering of data.
Plot of fatigue material data using an S-N curve.
S-N curve for different components of the one material. The black squares represent results from individual tests and indicate the scattering of data.
When evaluating test results, it is important to consider statistical effects as well. Here are two examples of such effects:
- If two sets of bars with different diameters are tested in tension with the same nominal stress, the larger one appears to have a shorter lifetime. The reason is that, within a larger volume of material, the risk of finding a microscopic defect of a certain size is greater.
- If the same type of bar is tested when subjected to both tensile and bending loads, but giving the same peak stress, the one tested due to bending appears to have a longer lifetime. During bending, only a small volume of the material is subjected to the greatest stress.
Additionally, effects such as surface treatment and operating environment will further influence the fatigue strength.
The combination of all of these effects as well as the consequences of a potential failure must be taken into account when transforming measured data into allowable values for a certain structure.
Published: March 15, 2016Last modified: February 21, 2017